8.1 Climatology
Climatically, the city of Bengaluru is located in the warm-humid climate zone and is considered as the most pleasant city in southern India owing to its topographical elevation. Bengaluru has a Tropical Savanna climate with distinct wet and dry seasons. Due to its high elevation, the city usually enjoys a more moderate climate throughout the year, although occasional heat waves can make summer a tad uncomfortable. There are 57 rainy days in a year on an average and that receive an average annual rainfall of 94cm. Heavy rainfall (64.5 mm in 24 hours) in Bengaluru city is mostly confined to second half of the Pre-monsoon season, Post-monsoon during break in monsoon season and also in association with weather systems like depressions/ cyclones approaching/passing through Bengaluru. Temperature ranges from to Winds are generally light; Winds are strong during South West (SW) monsoon season and predominantly are from westerly direction. Skies are heavily clouded to overcast during SW monsoon season and to lesser extent in the post-monsoon season. During the rest of the year skies are mostly clear.13
8.1.1 Temperature
The highest temperature ever recorded in Bengaluru is (recorded in May 1931). However, the suburbs of Bengaluru recorded temperatures as high as The lowest ever recorded is (recorded in January 1884). Winter temperatures rarely drop below and summer temperatures seldom exceed The average mean maximum temperature in the past decade varied in the range of to whilst the average mean minimum temperature varied between to
Figure 8-1 presents the Average Monthly variation of temperature for the previous decade (2001-2013). It suggests that the average mean maximum temperature in the past decade varied in the range of to whilst the average mean minimum temperature varied between to
It can be seen that the higher mean maximum temperatures occur in the months of April and May and the variation between the years 2004 to 2013 in the range of to Also, the average of the mean maximum temperature during the same period is in the range between to the variation being of Similarly cooler days occur in the months of December and January, with the lower mean minimum temperatures recorded in the range of to
12 The seasons in India as per IMD are; Winter Season (January & February); Pre-Monsoon season (March, April & May), Monsoon (June, July, August & September), and Post-Monsoon (October, November & December).
13 Weather Services to Karnataka State Booklet of Indian Meteorological Department (IMD), Metrological Centre, Bengaluru, June 2011.
BANGALOE AUTHORITY ★
Figure 8-1: Average Monthly variation of Temperature for period 2001-2013 in BMA
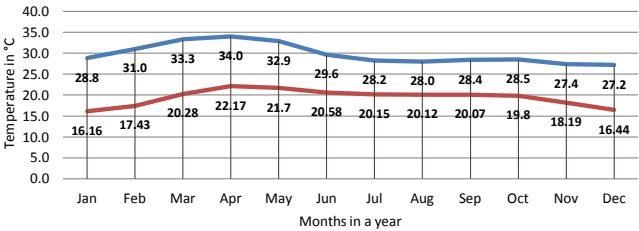
Average Mean Max Temperature in °C Average Mean Min Temperature in °C
Source: IMD Database of 2004-2014
8.1.2 Rainfall
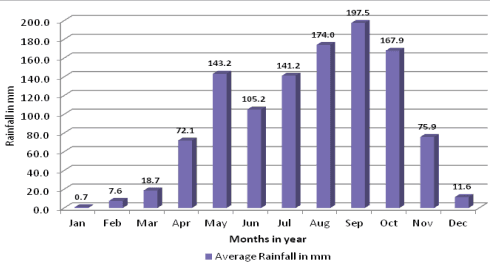
Bengaluru receives rainfall from both the North-East and the South-West monsoons and the wettest months are those of September, October and August, in that order. The summer heat is moderated by fairly frequent thunderstorms which cause power outages and local flooding. The heaviest rainfall recorded in a 24-hour period is 179 mm, recorded on 1 October 1997. The analysis of heaviest rainfall data for 2004-2014 over 24 hours indicates that the occurrence of heavy rainfall is very frequent for city of Bengaluru. Every year city receives heaviest rainfall during April to November period, which is wide range. The city thus needs to be prepared for heaviest rainfall any time during the year. The Bruhat Bangalore Mahanagar Palike (BBMP) area receives an annual average rainfall of 900 mm. Nearly 72% of this annual rainfall is from South-West monsoon (June- September) and rest of the rainfall is from North-East monsoon (October- December). Figure 8-2 presents the average monthly variation of rainfall for the period of 2004-2013.
Figure 8-2: Average Monthly variation of Rainfall for period 2001-2013
Source: IMD data for the period 2004-2014
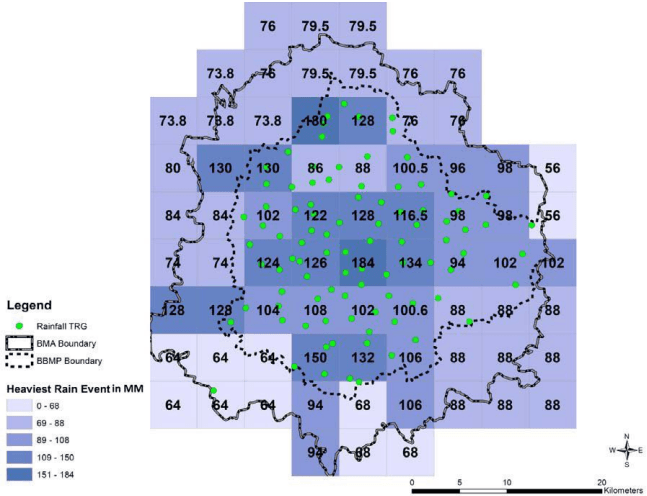
Grid density map has been prepared for the heaviest rainfall recorded at the KSNDMC telemetric rain gauges (TRGs) from 01.01.2013 to 31.03.2015, where the planning area has been divided into 5km X 5 km grids. The heavy rainfall alerts during past three years have been mapped. Figure 8-3 presents the Grid Density map of BMA which plots the heavy rainfall calibrated in the said grids. As the TRG locations are available only within the BBMP, in the case of grids which are devoid of any TRG in rest of BMA, the heaviest rainfall has been marked by optimisation, taking into account the heaviest rainfall recorded in the nearby TRGs. As seen from the map it can be inferred that the heaviest rainfall has been recorded by the TRGs that are located in the central area of the BBMP (erstwhile BMP) than the rest of the areas.
Figure 8-3: Grid Density Map of Heavy Rainfall in BMA
Source: KSNDMC, 2015 and Consultants Analysis 2015
It is noted that during heavy and erratic rainfall in Bengaluru, there have been instances of trees getting uprooted and their branches falling on the roads time and again. This poses a hazard to the commuters, vehicles and the overall city infrastructure (roads/street lights etc.). It is imperative that adequate planning strategies must be employed while planning city infrastructure, like road network, street design, landscape and urban design such that these instances of tree felling are avoided.
BANGALOE AUTHORITY ★
8.1.3 Relative Humidity
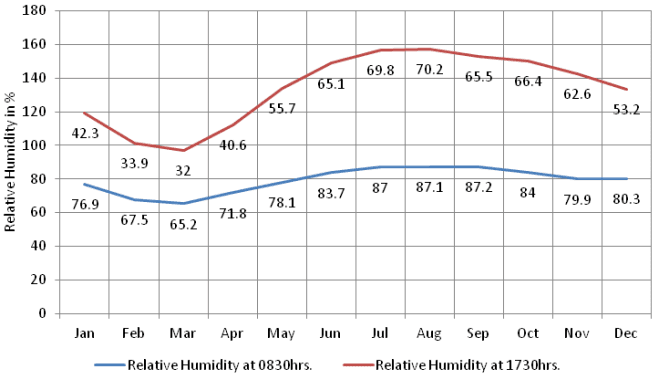
Relative humidity in Bengaluru varies from 32% in the month of March to 87% in August- September. The relative humidity is more than 65% during July to November months. Sunlight hours for the city range from 3.0 hours during July to 9.5 hours during March. The area experiences sunshine hours of 6.7 hours per day. Figure 8-4 presents the variation of humidity in Bengaluru at 08:30 hrs and 17:30 hrs.
Figure 8-4: Monthly Average Relative Humidity
Source: IMD data for the period 2004-2013
8.1.4 Wind Speed and Wind Direction
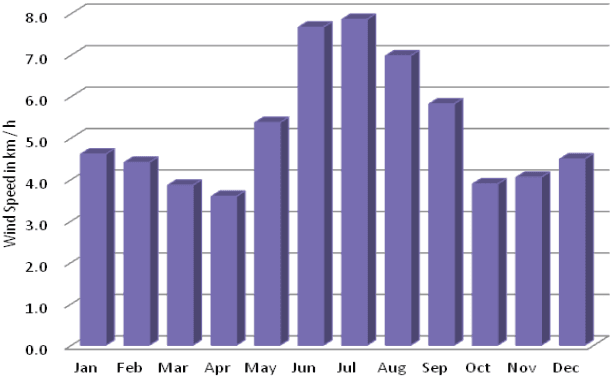
The surface winds in Bengaluru have seasonal character with the easterly components predominating during one period followed by the westerly in the other. The high wind speed averages 17 km/h during the westerly winds in the month of July and a minimum of 8-9 km/h during the months of April and October.
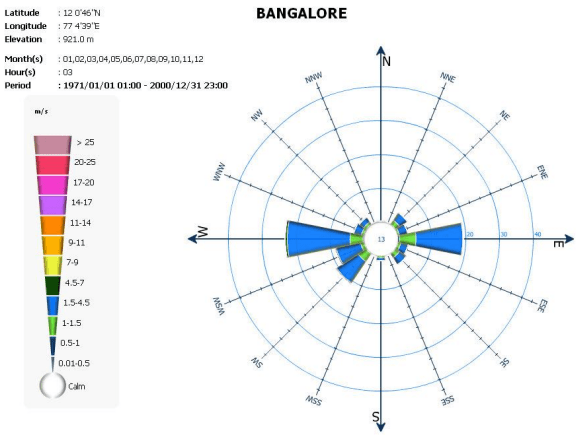
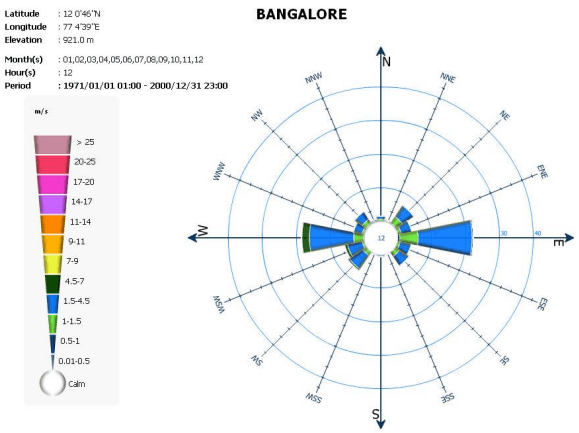
Figure 8-5presents the month wise average wind speed of Bengaluru for the period of 2004 to 2013. Annual wind rose diagram of Bengaluru recorded at 08:30 hr and 17:30 hr presented in Figure 8-6. Data has been represented as 30 years average. At 8:30 hr (morning period) annual wind speed is in the range of 1.5 - 4.5 m/s i.e 5.4 to 16.2 km/h14.Wind direction is mostly easterly or westerly. Calm condition is only 13% cases. At 17:30 hr (evening period) wind direction is mostly easterly or westerly, like at 08:30 hr. Wind speed is mostly in the range of 1.5-4.5 m/s i.e 5.4 to 16.2 km/h. Occasionally wind speed increased to 4.5 – 7.0 m/s i.e 16.2 km/h to 25.2 km/h. Calm conditions are
14 The unit of wind speed is in meters per second (m/s) which is equal to 3.6 km per hour(km/h)
prevalent only 12% cases at 17-30 hr. The Table 8-1 presents the prevalent wind directions at 08:30 hrs and 17:30 hrs for 30 years average.
Figure 8-5: Month wise Average Mean of Wind Speed (in km/hr)
Source: IMD data
| Month | Prevalent Wind Direction | |
| 08:30 Hrs | 17:30 Hrs | |
| January | EAST | EAST |
| February | EAST | EAST |
| March | EAST | EAST |
| April | SOUTH WEST | EAST |
| May | WEST | WEST |
| June | WEST | WEST |
| July | WEST | WEST |
| August | WEST | WEST |
| September | WEST | WEST |
| October | EAST | EAST |
| November | EAST | EAST |
| December | EAST | EAST |
Source: IMD. Bengaluru
BANGALOE AUTHORITY ★
Figure 8-6: Annual Windrose at 08:30 hr
Source: IMD. Bengaluru
AUTHORITY ★