Bengaluru has a long history, but the recording of census of population in Bengaluru began from 1871. It is notable here that since the first census, Bengaluru has been the most populous city in the State of Karnataka. Bengaluru has retained its primacy in the state for more than a century now. RMP-2031, given the available census information, has extracted population data for the unified area (BMA) for the past five decades i.e 1971 to 2011. Census information broadly coincides with the formation of BDA in 1976 and that the Jurisdiction of BMA has remained constant for all these years except for modifications due to administrative changes. However, the municipal boundaries/ urban agglomeration have changed every decade. In case of BBMP, present municipal boundaries have been used to arrive at historical data for BBMP.
BMA comprises of LPA of BDA (1206.97 sqkm) and part of LPA of BMICAPA (87.03 sqkm). Also, BMA comprises of BBMP and 251 villages around the BBMP. It is important to note here that several villages and BBMP is governed by two authorities (BDA and BMICAPA), for this reason Master Plan has considered the entire BMA, BBMP and Villages for extraction and analysis of population within BMA.
6.2Population Trends
Population in BBMP and BMA has grown rapidly as evident from Table 6-1, which presents the growth of population in BBMP, BMA and villages within BMA for past five decades and Figure 6-1 presents the details of planning area.
Table 6-1Population Trends for BMA
Year
BBMP
Villages in BMA
BMA
Population
GR%
CAGR
Population
GR%
CAGR%
Population
GR%
CAGR%
1971
1897826
113879
2011705
1981
3100811
63.4
5.03
157664
38.4
3.31
3258475
62.0
4.94
1991
4320297
39.3
3.37
209500
32.9
2.88
4529797
39.0
3.35
2001
5887853
36.3
3.14
302163
44.2
3.73
6190016
36.7
3.17
2011
8443675
43.4
3.67
600989
98.9
7.12
9044664
46.1
3.87
Source: Census of India Handbooks and Master Plan Analysis, 20115-16
Note: GR- Decadal Growth Rate between two Census Years, CAGR – Compounded Annual Growth Rate
BBMP has consistently experienced high growth rates though there are variations between the decades. The growth rate in villages in BMA has doubled during 2001 to 2011. Due to larger influence of BBMP in the BMA, the BMA trend line is following the BBMP and is susceptible to this pattern in future considering the large chunk of lands available for development in the surrounding villages. This requires a clear supporting policy and regulatory framework supported with measures
to make the agricultural land in the BMA as productive asset for facilitating conservation of the agricultural land.
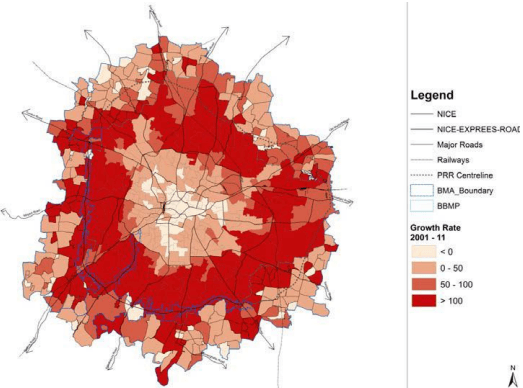
Figure 6-1: Population Growth in BMA (2001 to 2011)
Source: Census of India Handbooks and Master Plan Analysis, 2014-15
Assessment of growth rates within BMA in the past census decade (Figure 6-1), indicates that growth rates in most of the wards of the city’s core area (inside ORR) have been found to be in the negative, whereas a positive and a prominent growth rate is found in most of the wards belonging to the peripheral areas.
6.3Spatial Distribution of Population in BMA
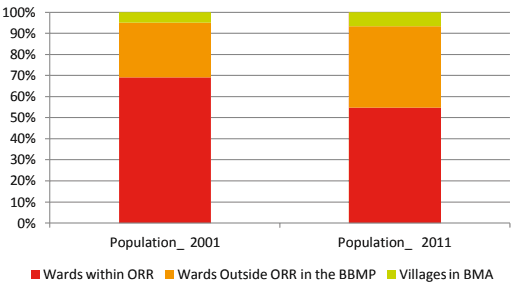
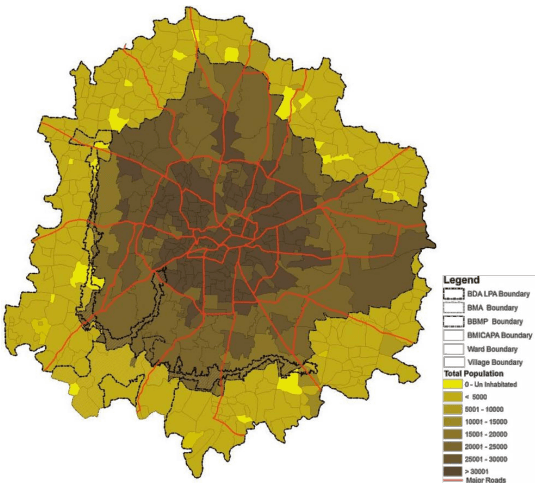
The BMA has been classified into three spatial spreads a) BBMP wards within ORR, b) BBMP wards outside ORR and up to the BBMP boundary and c) Villages in BMA to understand the spatial spread of the population. The population distribution in BMA in 2001 and 2011 is given in Table 6-2 and Figure 6-2. Figure 6-3 shows the population distribution of wards of BBMP and the villages in BMA as per population class range.
Table 6-2Population Distribution in BMA
Spatial Spread
Population
Share of Population
Decennial Growth Rate
2001
2011
2001
2011
Wards within ORR
4241540
4960809
69.1
54.8
16.96%
Rest of BBMP
1598615
3482866
26.0
38.5
117.87%
Villages in BMA
302163
600989
4.9
6.6
98.90%
Total BMA
6142318
9044664
100
100
47.25%
Source: Census of India Handbooks and Master Plan Analysis, 2014-15
AUTHORITY ★
Figure 6-2: Population Distribution within BMA
Source: Census of India Handbooks and Consultant’s analysis, 2014-15
Figure 6-3: Population Distribution in BMA
Source: Census of India Handbooks and Master Plan Analysis, 2014-15
AUTHORITY ★
6.4Density of Population
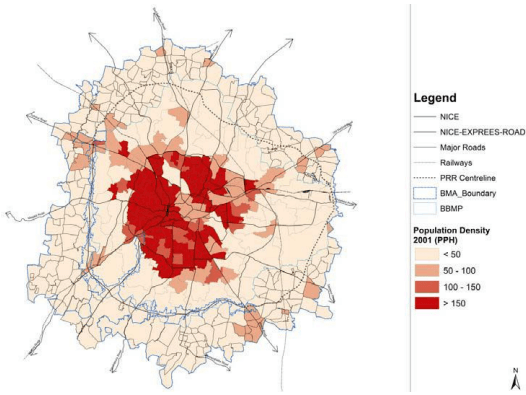
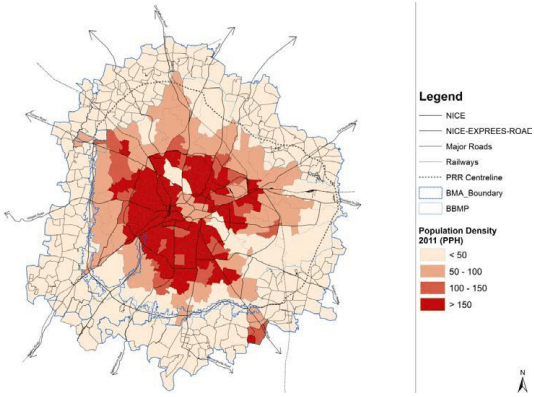
Population Density is defined as the number of persons per hectare (PPH). As per the census records of 2001 and 2011, the population density values for the BMA and the BBMP have gone up from 47 to 70 and 82 to 119, respectively, whereas the population density in village has doubled from 5 to 10 pph. Around 23 inhabitants were added on every hectare of BMA during the 2001-11 whereas in BBMP, 37 persons have been added for every hectare during the same period. The core areas of the city have high density; while it reduces as moving away from core to the peripheral areas (Table 6-3). However, with close observation the percentage change in the density is at the highest with 118% for the wards located outside ORR in the BBMP followed by the villages with 99% in the 251 Villages in BMA. The core city area which has wards inside the ORR has exhibited growth of only 17% during 2001-11. The ward wise and village wise population density for BMA for the year 2001 and 2011 is presented in Figure 6-4 and Figure 6-5 respectively
Table 6-3Variation in Densities for different spatial units
Spatial Spread
Area in Ha
Population
Density (PPH)
Increase in Density (%)
2001
2011
2001
2011
Within ORR
21689
4241540
4960809
196
229
17%
Rest of the BBMP
49461
1598615
3482866
32
70
118%
BBMP
70829
5840155
8443675
82
119
45%
Villages in BMA
58571
302163
600989
5
10
99%
BMA
129400
6142318
9044664
47
70
47%
Source: Census of India Handbooks and Master Pan Analysis, 2014-15
Figure 6-4: Population Density of BMA 2001
BANGALOE AUTHORITY ★
Figure 6-5: Population Density of BMA 2011
Source: Census of India Handbooks and Master Plan Analysis, 2014-15
6.5Birth and Death Rate
Since BMA is not an administratively well-defined region hence the required demographic rates for projection are not available. Hence, the demographic rates as maintained by the Registrar of Births and Deaths for defined region such as BBMP/ BUD has been used with an assumption that the maintained rates hold good for BMA. Accordingly, the following assumptions have been made to derive the future population for the BMA. The birth rates for BBMP for 2001 and 2011 are 20.3830 and 16.4699 respectively. Similarly, the corresponding death rates are 8.3395 and 5.7309. Hence, natural increase rates for 2001 and 2011 are 12.0435 and 10.7390 respectively. The difference in natural increase rates during 2001 and 2011 is (-1.3045).
6.6Migration
Migration is movement from one place to another during a time period. It is thus place and time specific. It has also direction; from and to. Migration is one of the most important components of population change. Whereas change is due to natural factors such as fertility, mortality, changes gradually and steadily, migration immediately responds to changes within and beyond the area under consideration. Migration changes the structure of original population and brings in its own structural patterns from different angles in the social, economic and demographic sense.
After Independence, Bengaluru, the State capital, saw an influx of population migrating to the city for better employment and livelihood opportunities. The census data from 2001 indicates that, among the total in-migrants into the state, about 19% are settled in BMR. Furthermore, 12% of the
in migrants into the state are in Bangalore Urban Agglomeration alone. The rate of in-migration to BUA has increased with a CAGR of 4.2% in an inference of the census estimates spanning from 1971 to 2001. The total number of migrants has increased from 6, 24,215 in the year 1971 to 20, 86,719 in 2001, and by 2001, about 36.5% of the city’s population are in-migrants. With an exception of the decade 1981-1991, all the decades indicate a very high growth of in migrants, as indicated in the table shown hereunder.
Table 6-4Migrants in Bangalore Urban Agglomeration
Year
Population
Natural Increase
% Share
Migrants
% Share
1971
1664208
1039993
62.49
624215
37.51
1981
2921751
1822525
62.38
1099226
37.62
1991
4137314
2952146
71.35
1185168
28.65
2001
5701446
3614727
63.40
2086719
36.6
Source: Census of India Handbooks and Master Plan Analysis, 2014-15
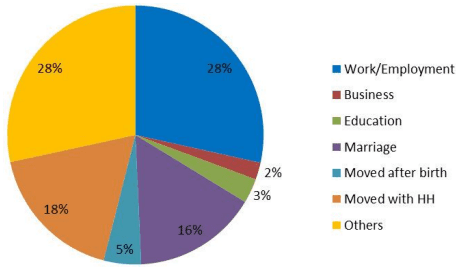
It is important to note here that in the migration break up is that about 60% of the migrants to the Bangalore Urban Agglomeration are from within the Karnataka, while 38.7% of the migrants are from outside Karnataka. In 2001, about 28% of all the people migrated (i.e.20,86,719) to the Bangalore Urban Agglomeration, have migrated for better work and employment opportunities. However, only 11% of them are female. The percentage of female migrants is higher among the sections that have migrated for the reasons “marriage” and “moved with households/family”, being 60% and 97.2% successively. Various social and economic reasons other than for work and employment, also have contributed to the migration phenomenon.
Figure 6-6: Reason for Migration - 2001
Source: Census of India Handbooks and Master Plan Analysis, 2014-15
6.7 Sex Ratio
Sex ratio is denoted by number of females per 1000 males. The sex ration in BMA has increased from 902 in 1981 to 918 in 2011. However, during the same period, in villages of BMA, the sex ratio has
BANGALOE AUTHORITY ★
decreased from 884 in 1991 to 857 in 2011. Table 6-5 presents the sex ratio in BMA for past three decades.
Table 6-5Sex Ratio in BMA
Area
1991
2001
2011
BMA
902
907
918
BBMP
903
909
923
251 Villages in BMA
884
878
854
Source: Census of India Handbooks and Master Plan Analysis, 2014-15
6.8 Literacy Rate
Bengaluru has always recorded a high literacy rate since its inception due to the high quality of educational infrastructure available in the city. The literacy rate in BMA has increased from 77.5% to 88.3% during the period 1991-2011. The literacy rate in 2011 is higher than Karnataka Urban (85.7%).
6.9Population Age Pyramid
Age structure of a population in a city / metropolis plays a major role in urban planning. It gives an idea about dependent population, working population, jobs to be created, the present and future requirements of land, educational, health and other facilities and amenities. It depends on birth rate, death rate and also migration.
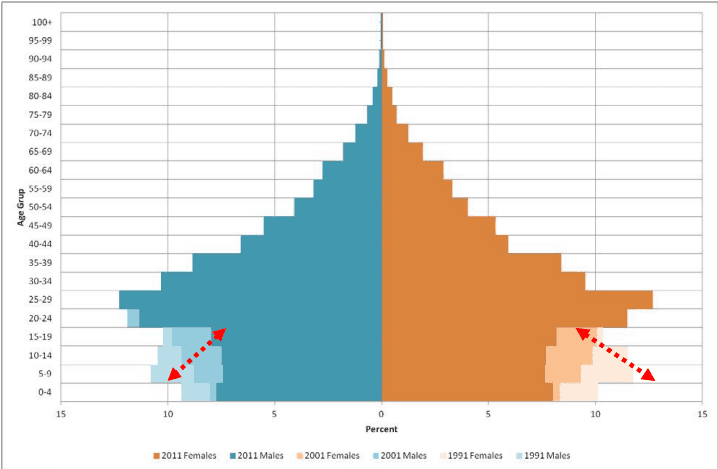
The Population pyramid is shown in Figure 6-7 indicating the higher migration into the city of the age group of 20 to 60. However, the base of the pyramid which is in the age group of 0 to 14 is wider enough to reflect higher birth rate in the city (15 out of 1000 persons). The sides are not too concave reflecting the death rate is falling (6 out of 1000 persons). However, the lesser percentage of the people in peak of the pyramid indicates the life expectancy is better but still low.
The index of ageing increased rapidly from 18 elderly to 100 children in 1991 to 32 elderly to 100 children in 2011. However, the dependency ratio has decreased from 2 persons for every family to 3 persons per family. The number of persons in the age group of 15 to 60 has witnessed significant increase from 58% in 1991 to 63% in 2011. Especially the middle age group of 25 to 44 has increased tremendously from 30% in 1991 to 37% in 2011 reflecting the higher in-migration.
Further, analyzing information for the past three decades, the pyramid indicates the falling in birth and death rates from 1991 to 2011. The index of ageing indicates the shift in the balance between the child and older populations and is expressed as the number of persons above 60 years for every 100 children below the age of 15 years.
Figure 6-7: Population Pyramid of BMA for past three Decades
Source: Census of India Handbooks and Master Plan Analysis, 2014-15
6.10Household Size
Numbers of households have increased two and half times in last two decades from 9 lakh in 1991 to 22 lakh in 2011 for BMA. However, average household size in BMA has decreased from 4.99 in 1991 to 4.01 in 2011. The interesting fact is that the household size in villages has drastically decreased from 5.21 in 1991 to 3.97 in 2011 which is less than the BMA and BBMP. Table 6-6 presents details of households and household sizes for past three decades in BMA.
Table 6-6Households & Household Size in BMA
Year
1991
2001
2011
Area
No. of HH
HH Size
No. of HH
HH Size
No. of HH
HH Size
BMA
907413
4.99
1387508
4.47
2253744
4.01
BBMP
867199
4.98
1319342
4.46
2101831
4.02
251 Villages in BMA
40214
5.21
68166
4.52
151913
3.97
Source: Census of India Handbooks and Master Plan Analysis, 2014-15
BANGALOE AUTHORITY ★
6.11Population Projections
RMP-2031 has carried out projections for the spatially constant Bengaluru Metropolitan Area based on the past trends by deploying different statistical models and component method. The models and method included are:
Linear Model (this assumes that Population would increase steadily in a linear pattern);
Quadratic Model and Cubic Models (this assumes that population would experience fluctuations in growth pattern)
Logistic Model (this assumes that population would reach saturation at some point in the future).
Ration Method (this assumes that population would increase steadily in relation to Karnataka Urban Population)
Component Method (using birth and death rate and migration)
Population projections for BMA based on different methods (Statistical and Demographic) ranges from 11.8 million to 24.7 million for 2031. Table 6-7 clearly shows that Linear Method and Component (demographic) method are predicting two extreme ends of the projections. Linear method has projected the lowest population for 2031. However, these estimates are likely to attain by the year 2017 in reality. Hence, these estimates can’t be considered. The component method has projected population for higher end, which is almost 2.5times the 2011 population for BMA. Hence, considering this population may be inappropriate.
Table 6-7Observed & Projected Population Range for BMA: 1971-2031 (in ‘00000)
Year
Observed Population
Projected Population
Linear
Quadratic
Cubic
Logistic
Component
Ratio Method
1971
20.12
16.06
21.22
20.06
21.24
NA
NA
1981
32.58
33.08
30.50
32.83
30.60
NA
NA
1991
45.30
50.09
44.93
44.93
44.09
NA
NA
2001
61.90
67.11
64.53
62.20
63.51
NA
NA
2011
90.45
84.13
89.29
90.45
91.49
98.00
90.45
2016
92.64
103.60
110.52
109.81
116.26
108.20
2021
101.15
119.21
135.51
131.80
149.14
129.44
2026
109.65
136.10
166.17
158.19
192.20
157.93
2031
118.16
154.29
203.21
189.87
247.38
192.68
R-square6
0.96436
0.99540
0.99991
0.99376
NA
NA
Like any other forecasts, population forecasts have their limitations. Master Plan has attempted to project the population for the BMA by as scientific an approach as possible with available data. Predicting the future course of human fertility, mortality and migration is an educated guess at best, especially when these are bound to be deeply influenced by advancements in medicine, food production and availability, climatic variability, socio-cultural setting, political and economic conditions and a host of other factors. Therefore, caution must be exercised while making or using population projections. The main limitation of this population projection exercise is that the projections have been made on the basis of a limited five decades of data considering the unavailability of earlier Census records due to change in jurisdiction. Another limitation is limited data availability for age, sex, mortality & birth and in-migration at planning area level, which is essential input to the demographic method of population projection.
6 R-squared = Explained variation / Total variation; R-squared is always between 0 and 1. a) 0 indicates that the model explains none of the variability of the response data around its mean and b) 1 indicates that the model explains all the variability of the response data around its mean. In general, the higher the Rsquared, the better the model fits your data. However, there are important conditions for this guideline that I’ll talk about both in this post and my next post.
Population projections by three methods, namely Logistics, Ratio and Cubic method are in the range of 19-20 million. The projection by logistic model (19 million) is ideal considering the fact that the population cannot grow for ever due to its natural carrying capacity limit and instead population growth will taper off and reach saturation. However, while planning for metropolitan region it would be appropriate to plan for higher range to account for sudden growth in the population – which cannot be predicted. Also, that the R-square among the statics method is close to accuracy for cubic method.
The Population Projection methodology and results were shared with Department of Economics and Statistics, GoK and Institute for Social and Economic Change for independent review and confirmation. Both have confirmed that the BMA population could be in the range of 19 to 20 million by 2031. Hence it is appropriate to consider projections by Cubic method at 20.3 million for BMA by 2031.
6.12Future Age Distribution
The purpose of knowing demographic characteristic of future population is to understand the potential employable population, demand for social infrastructure, and social composition (age & sex).
For the purpose of assessment of Age Distribution, due to non-availability of age distribution for BMA, the age distribution pattern of urban population of BUD for 2001 and 2011 (as per census) has been considered. The percentage difference between 2001 and 2011 age distribution pattern has formed the basis for future (2021 and 2031) age distribution pattern of BMA.
Table 6-8 presents the most strategic age distributions for which future projections have been attempted based on representative description following national and international profiles.
Table 6-8Strategic Age Distribution Pattern
Age Distribution
Description
0 - 6
Infants
7 - 15
Education Aspirant Children
16 - 24
Higher Education Aspirant Children
25 - 44
Young Job Seekers/Employed
45 - 59
Middle Aged Skills
60 - 79
Aged And Dependents
80+
Aged Dependents
The age wise population distribution ratio for the 2021 and 2031 based on 2001 - 2011 pattern is presented in the below Table 6-9.
AUTHORITY ★
Table 6-9Projected age distribution of population for BMA for 2011, 2021 and 2031
Age
2011
2021
2031
Population
Male
Female
Population
Male
Female
Population
Male
Female
0-6
10.88
10.75
11.02
10.11
10.06
10.17
9.34
9.36
9.32
7-15
13.34
13.18
13.52
10.23
10.34
10.11
7.12
7.49
6.71
16- 24
17.77
17.53
18.03
15.63
15.15
16.16
13.49
12.76
14.29
25- 44
37.51
38.19
36.77
41.16
42.12
40.12
44.82
46.06
43.48
45- 59
12.86
12.9
12.82
13.91
13.56
14.3
14.97
14.23
15.78
60- 79
6.62
6.5
6.74
7.7
7.63
7.79
8.79
8.75
8.84
80+
0.89
0.8
0.98
1.11
1.01
1.22
1.33
1.21
1.46
Age not specified
0.13
0.14
0.12
0.13
0.14
0.12
0.13
0.15
0.12
Total
100
100
100
100
100
100
100
100
100
Source: Census of India and Estimates for RMP-2031